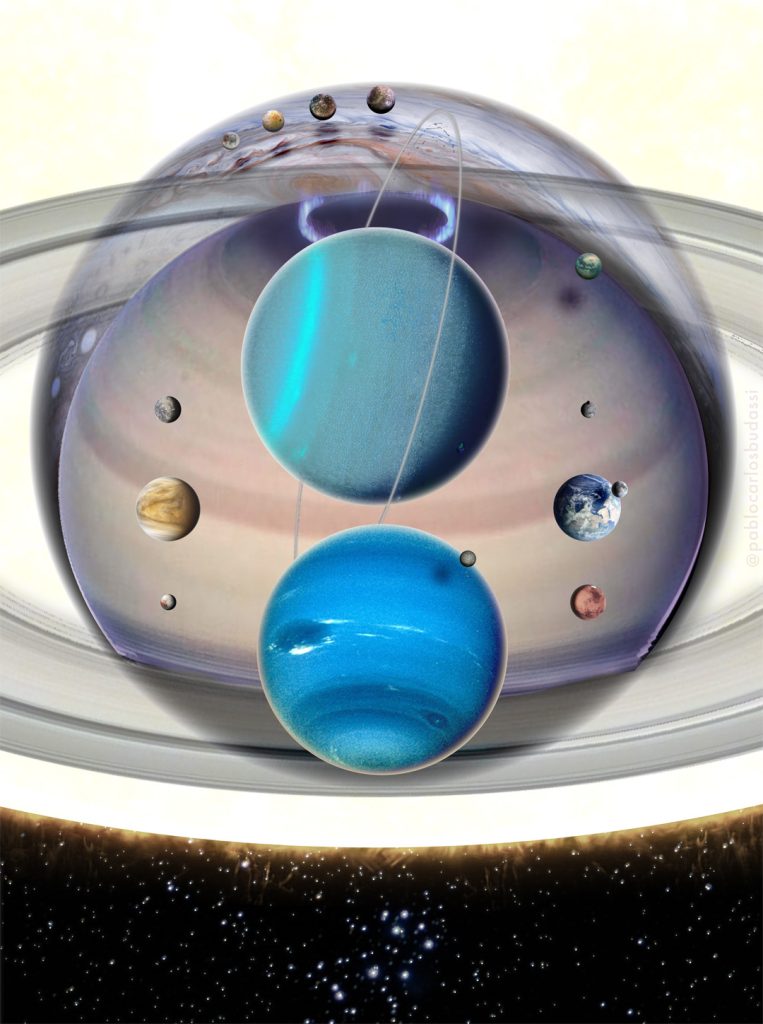
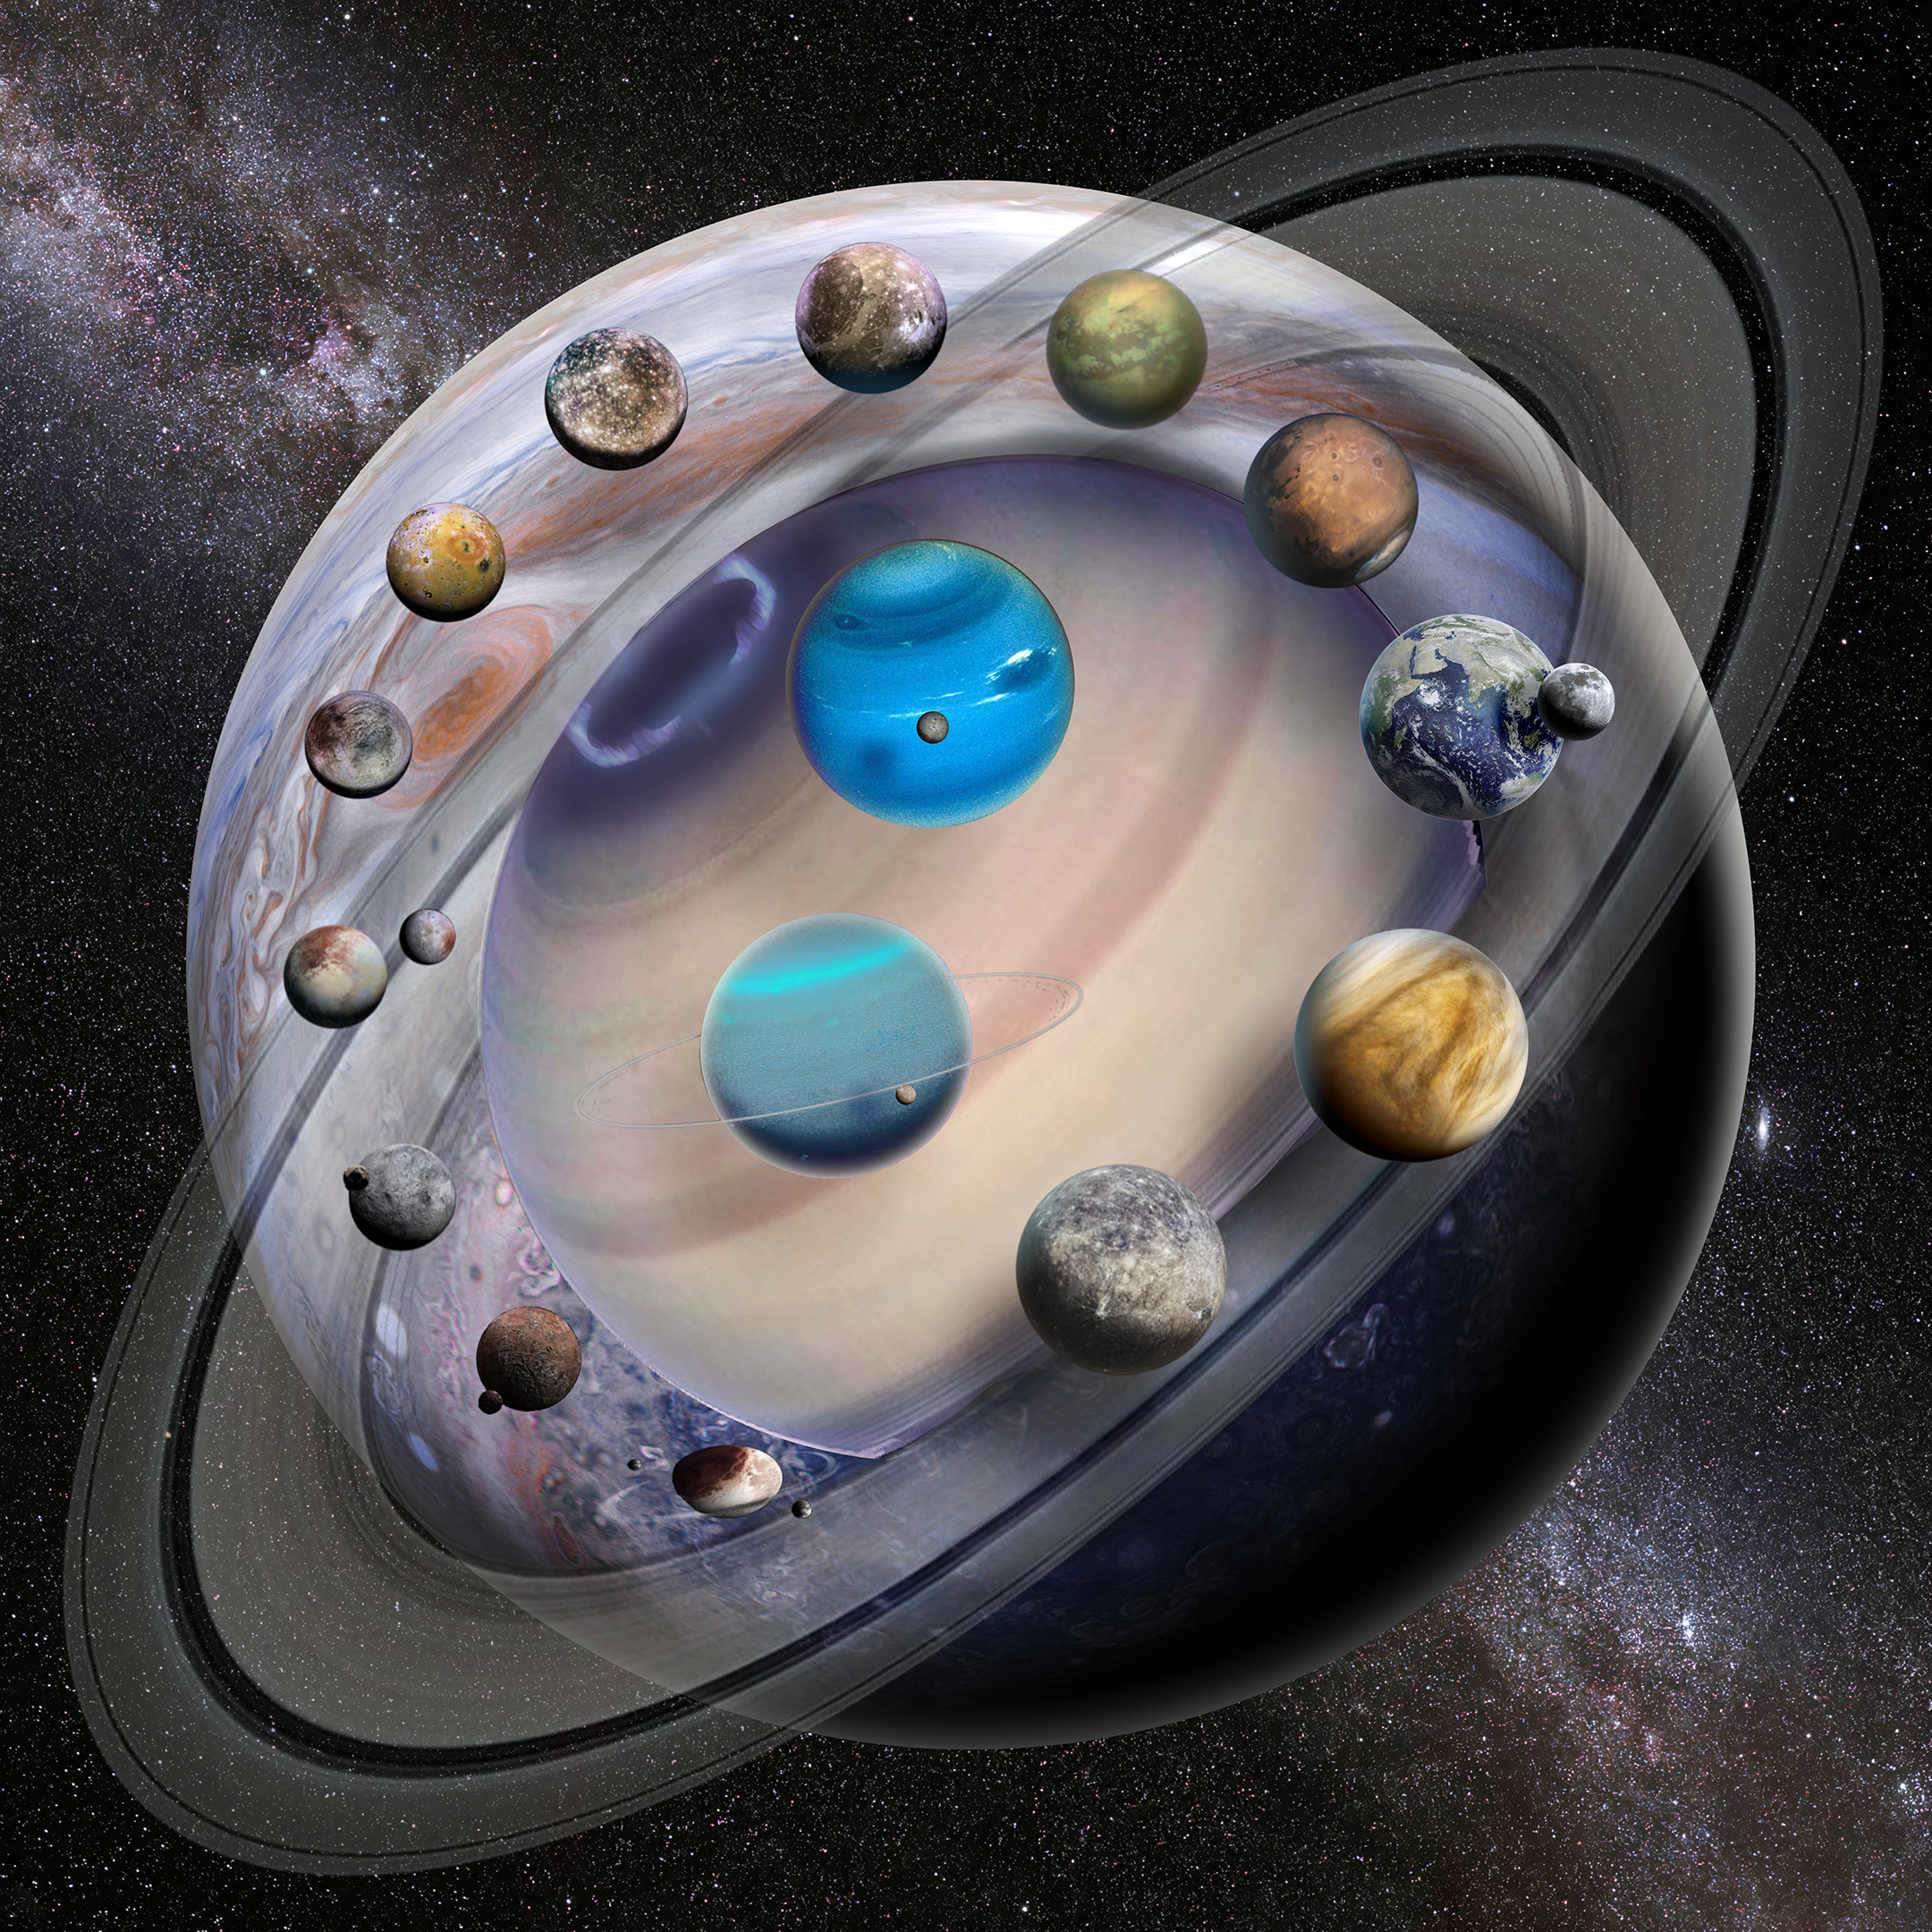
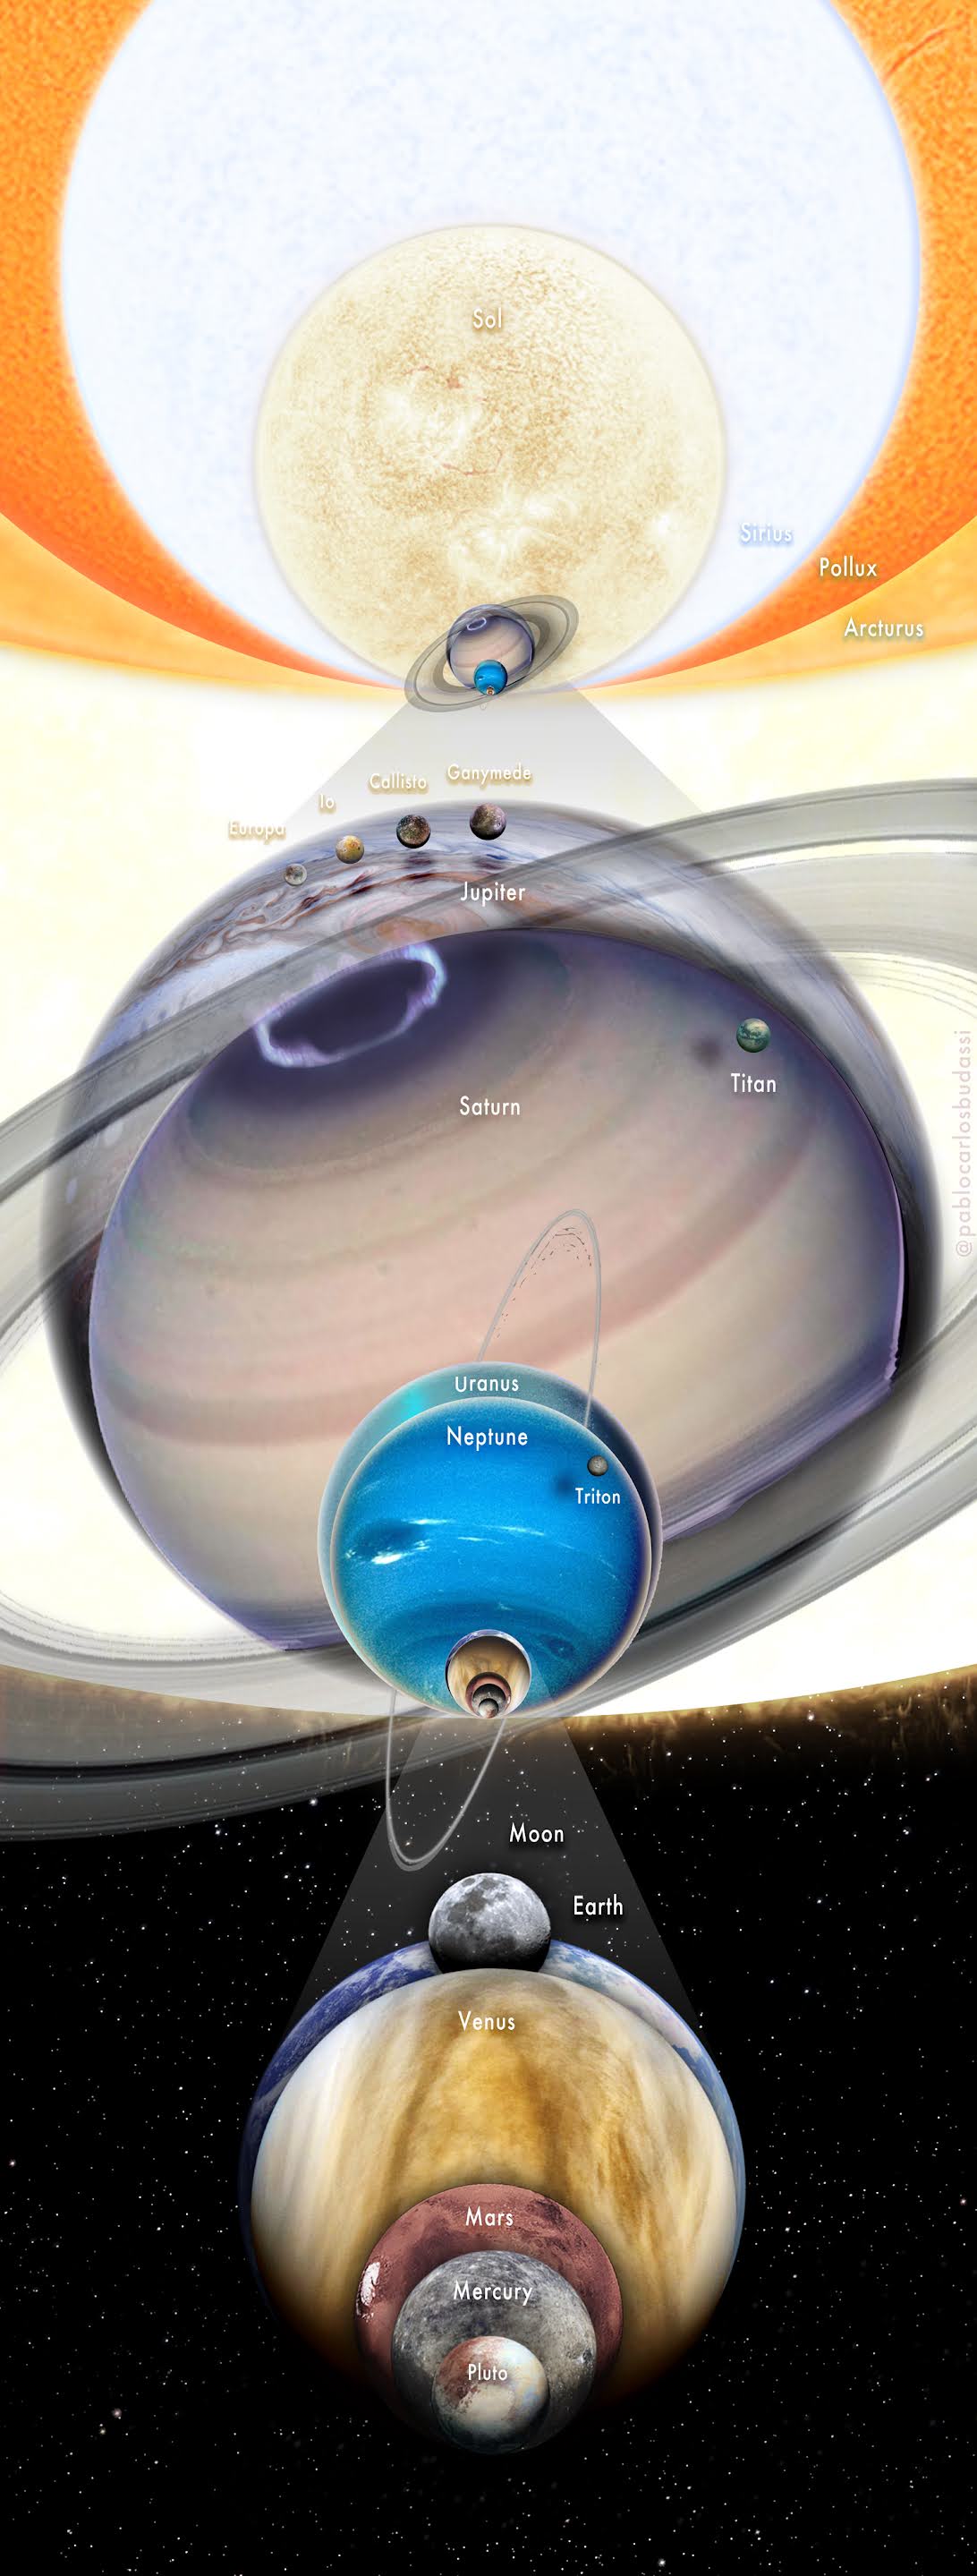
Presenting a frontal panorama of the Solar System’s ensemble, meticulously scaled to showcase the relative sizes of planets, dwarf planets, and significant moons. This cosmic portrait integrates the Pleiades star cluster proportionally with the solar visage. The compilation utilizes the highest quality images obtained of each solar system object depicted, providing a clear and realistic visual reference of our cosmic vicinity’s scale.
The planets and moons of the solar system are depicted here on a histogram-like scale, where sizes are shown in consistent intervals rather than the actual uneven progression of scales.
Posters and other merch available
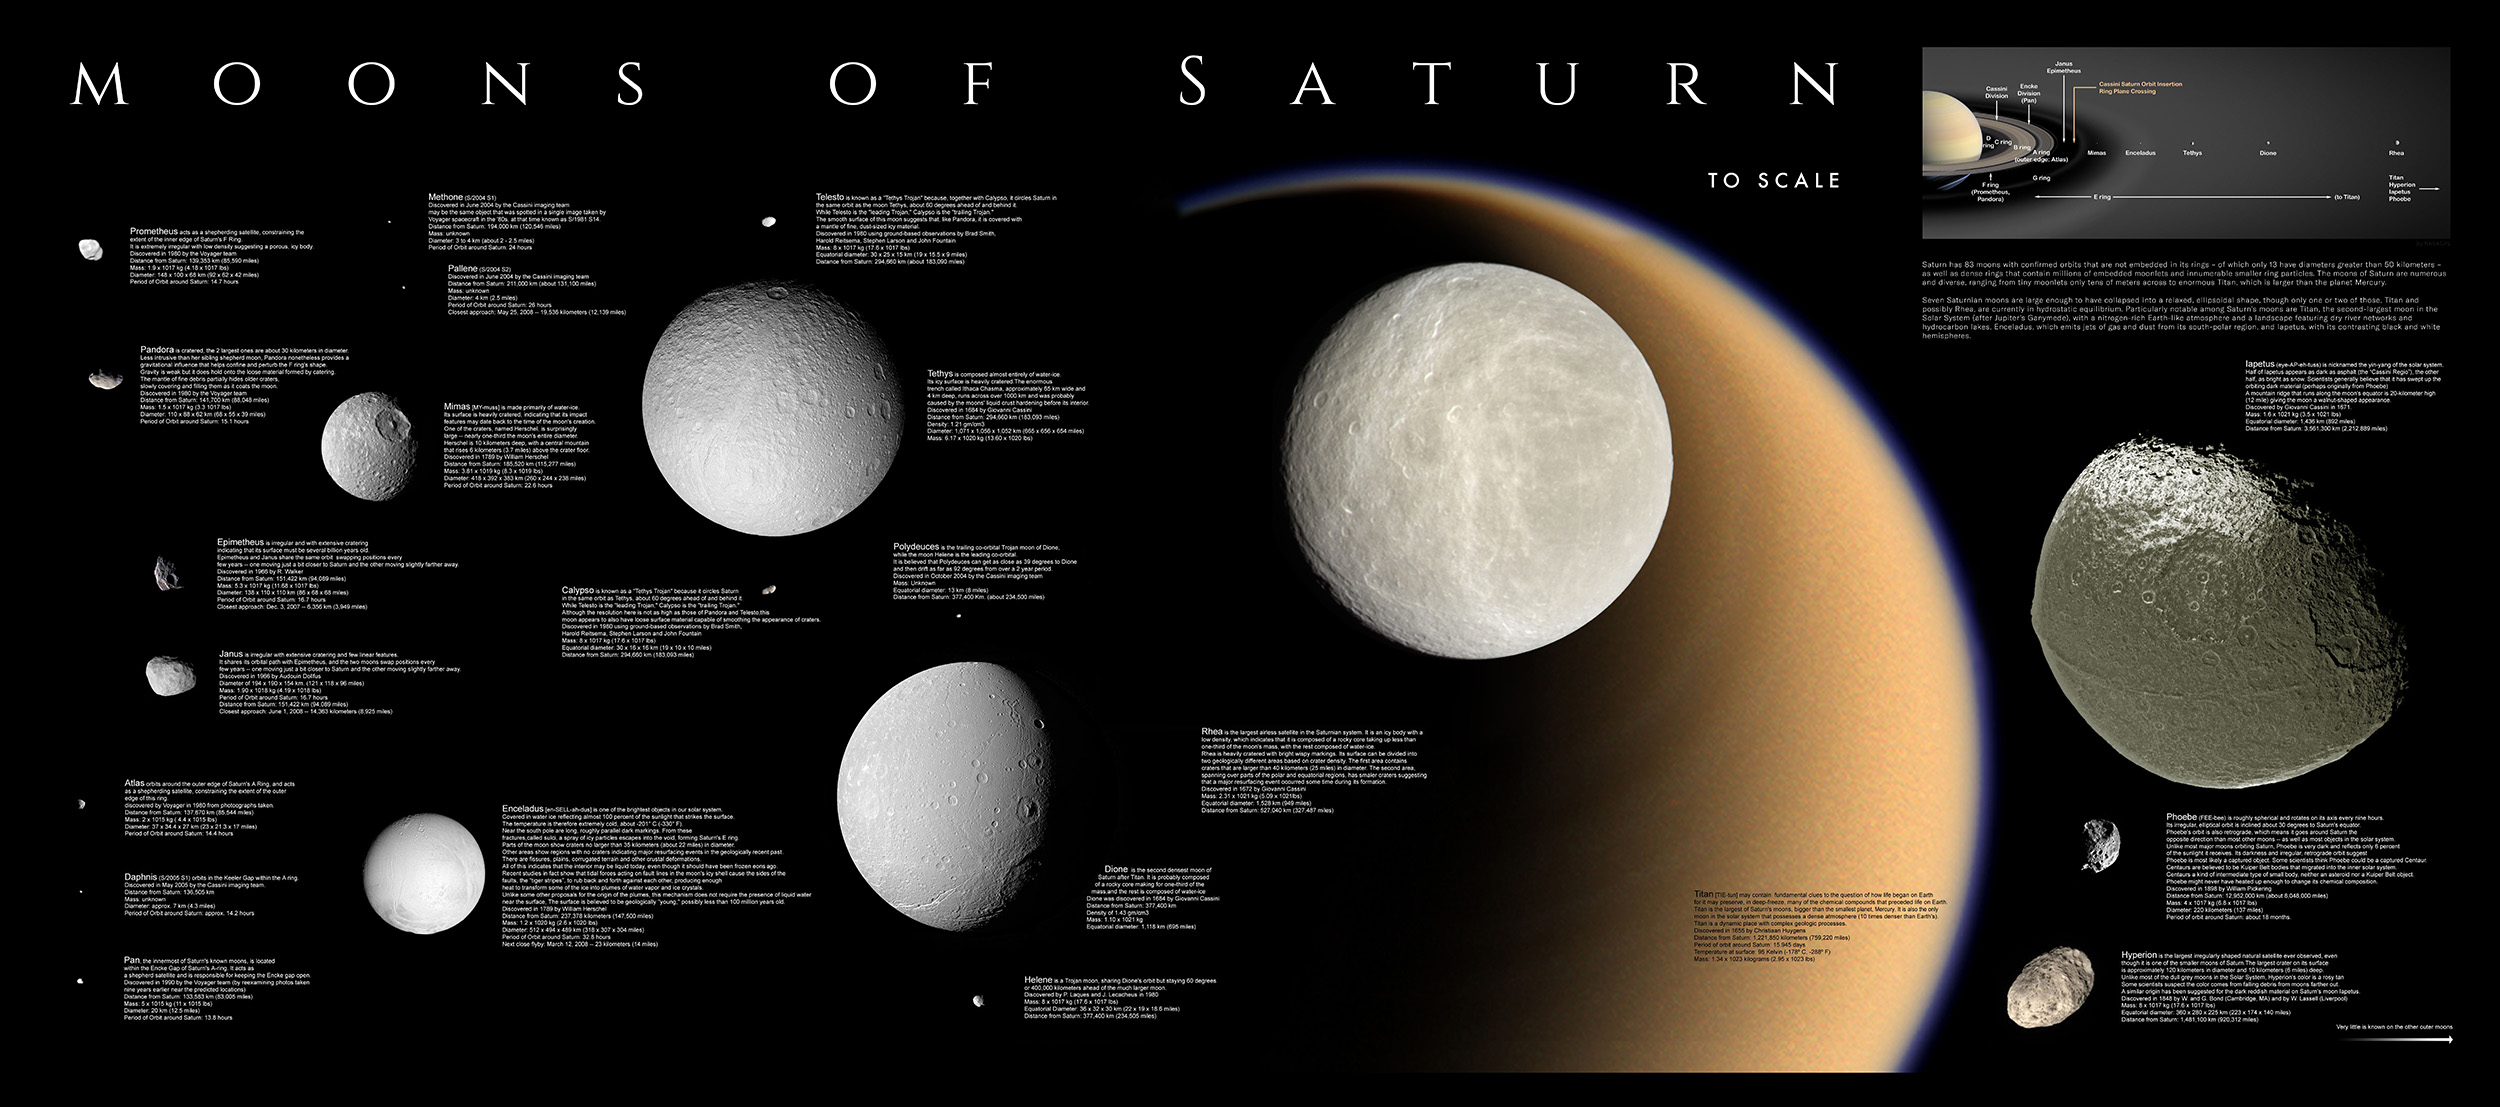
Fine design infographic showing major moons of Saturn to scale and their characteristics. This Pablo Carlos Budassi new design is inspired by NASA/JPL old graphic. May 2025 Updated.
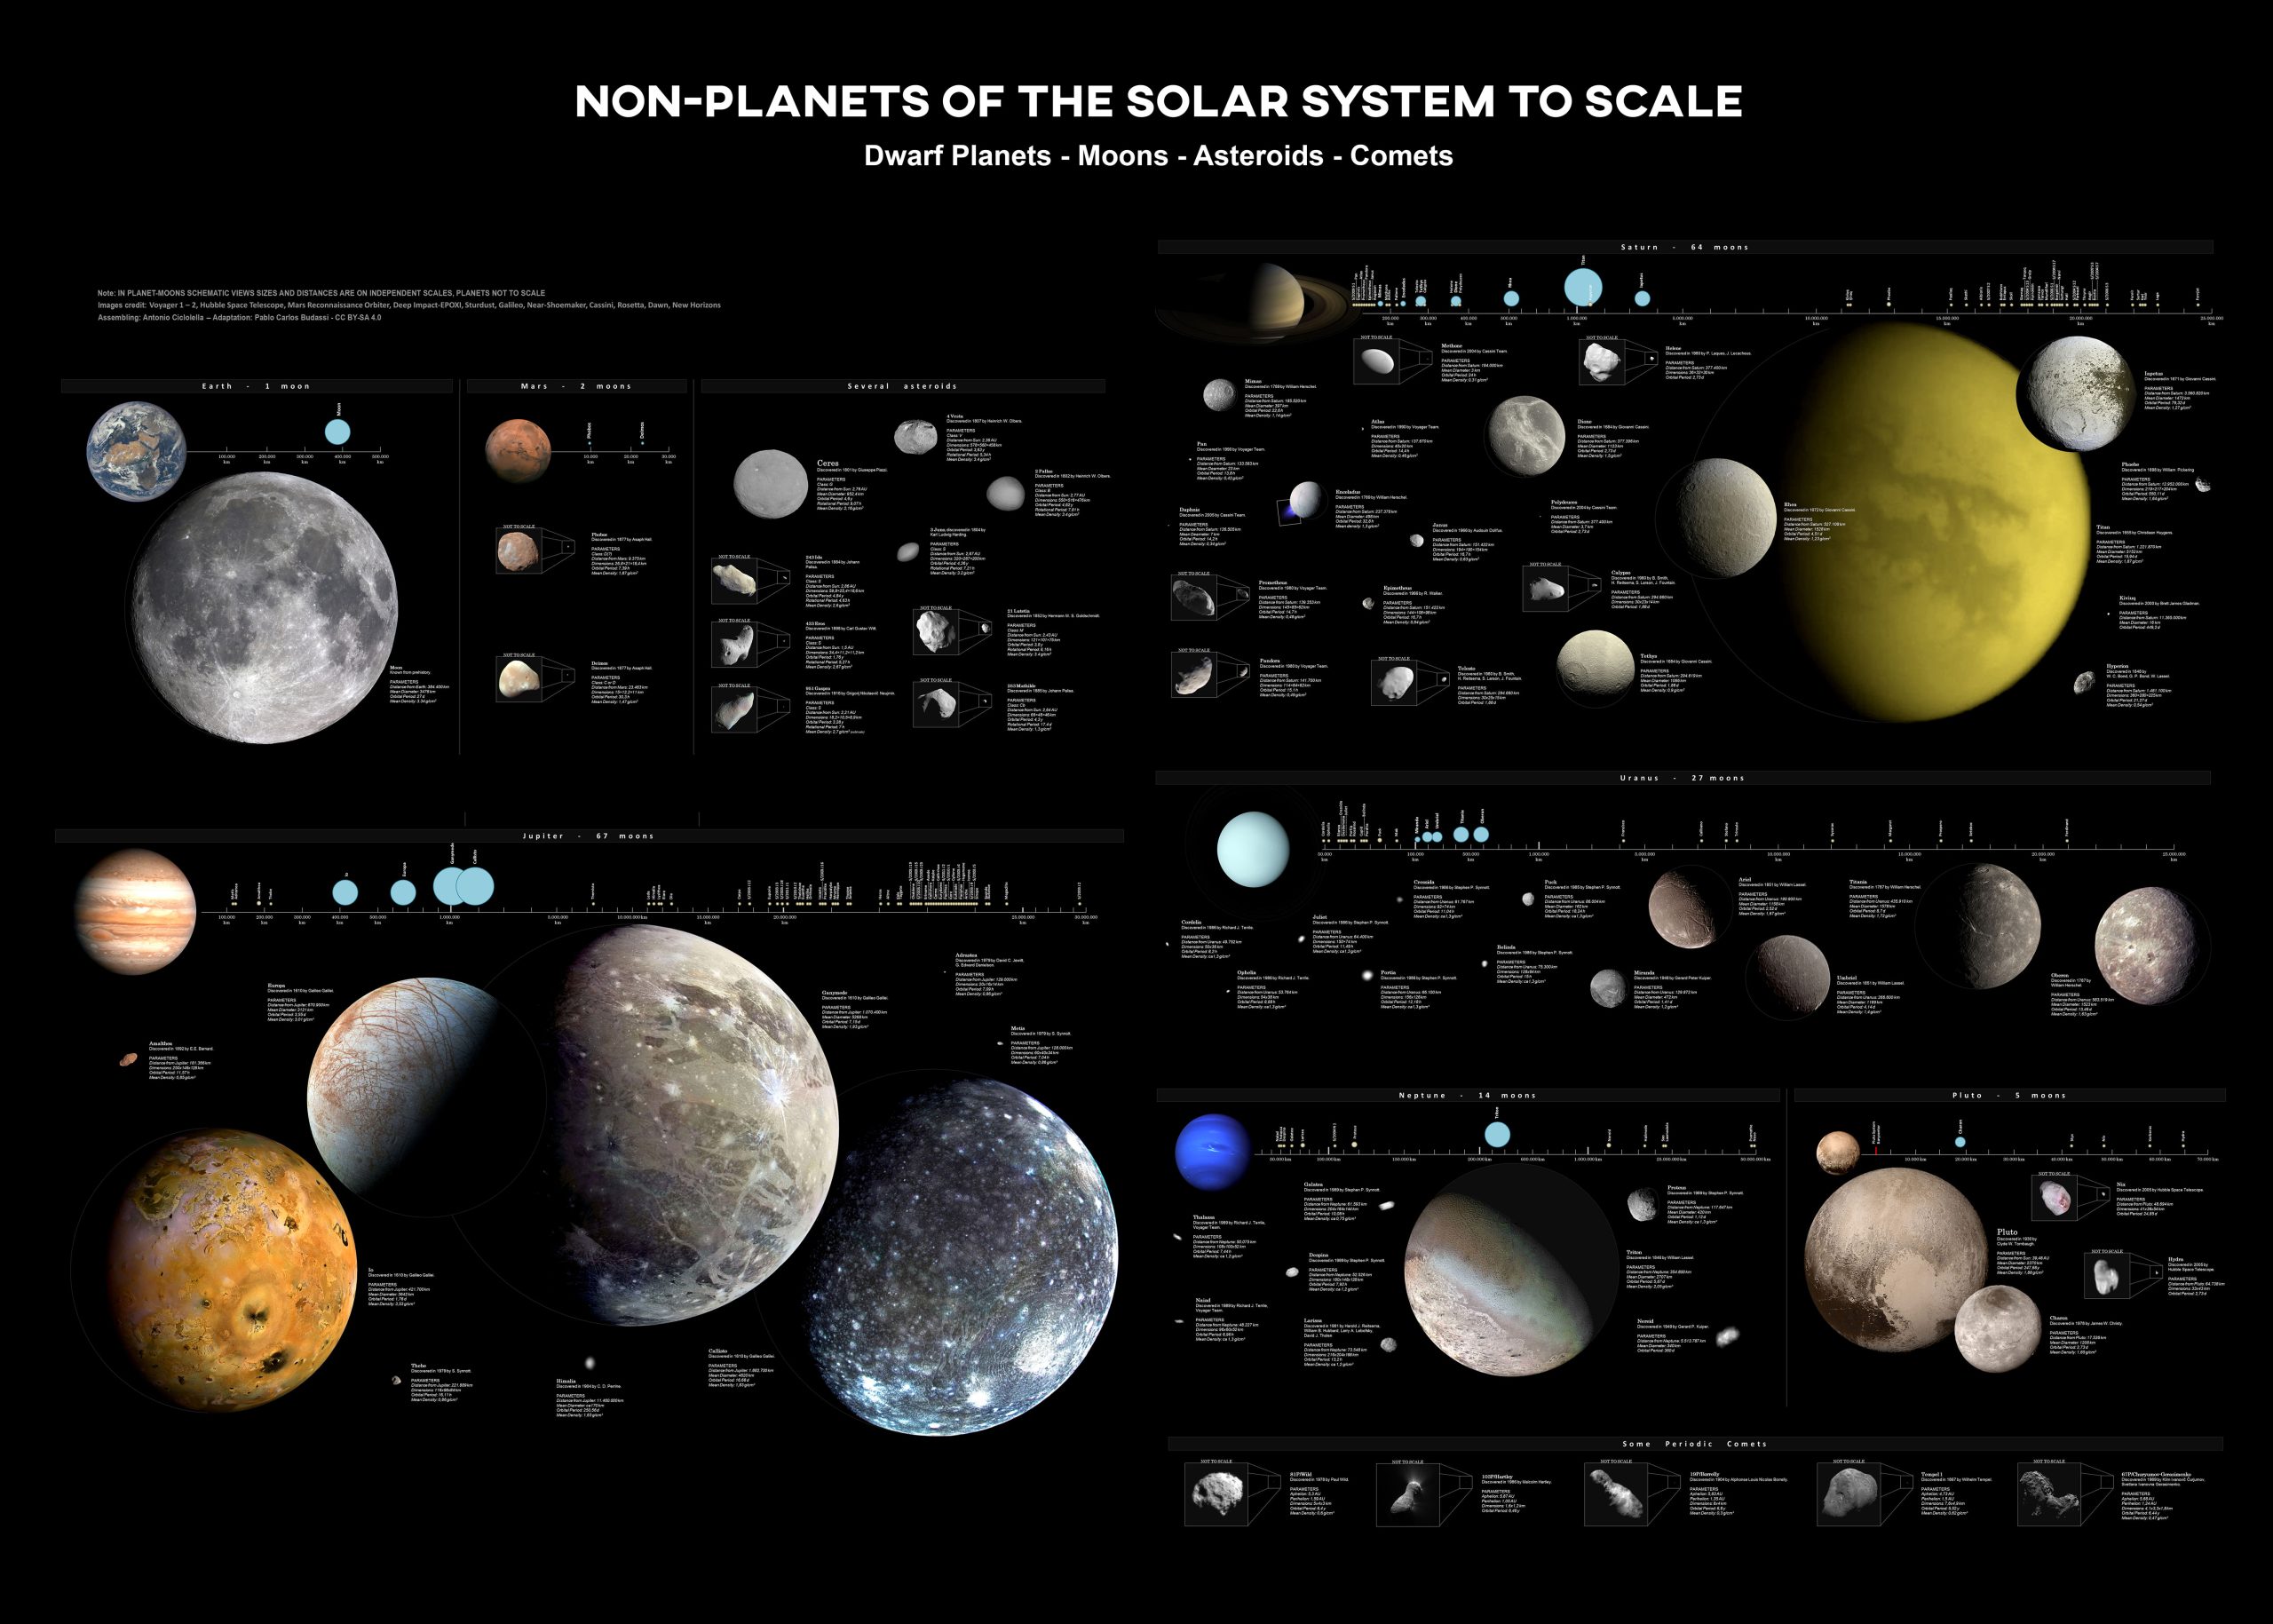
The largest non-planets of the Solar System to scale, including natural satellites, dwarf planets, asteroids, and minor-planet moons. Photomontage created from several images taken by space probes and telescopes. Original by Antonio Ciccolella, adapted in poster format by P. Budassi in 2020.
Buy Poster Mug Jigsaw Puzzle Other products
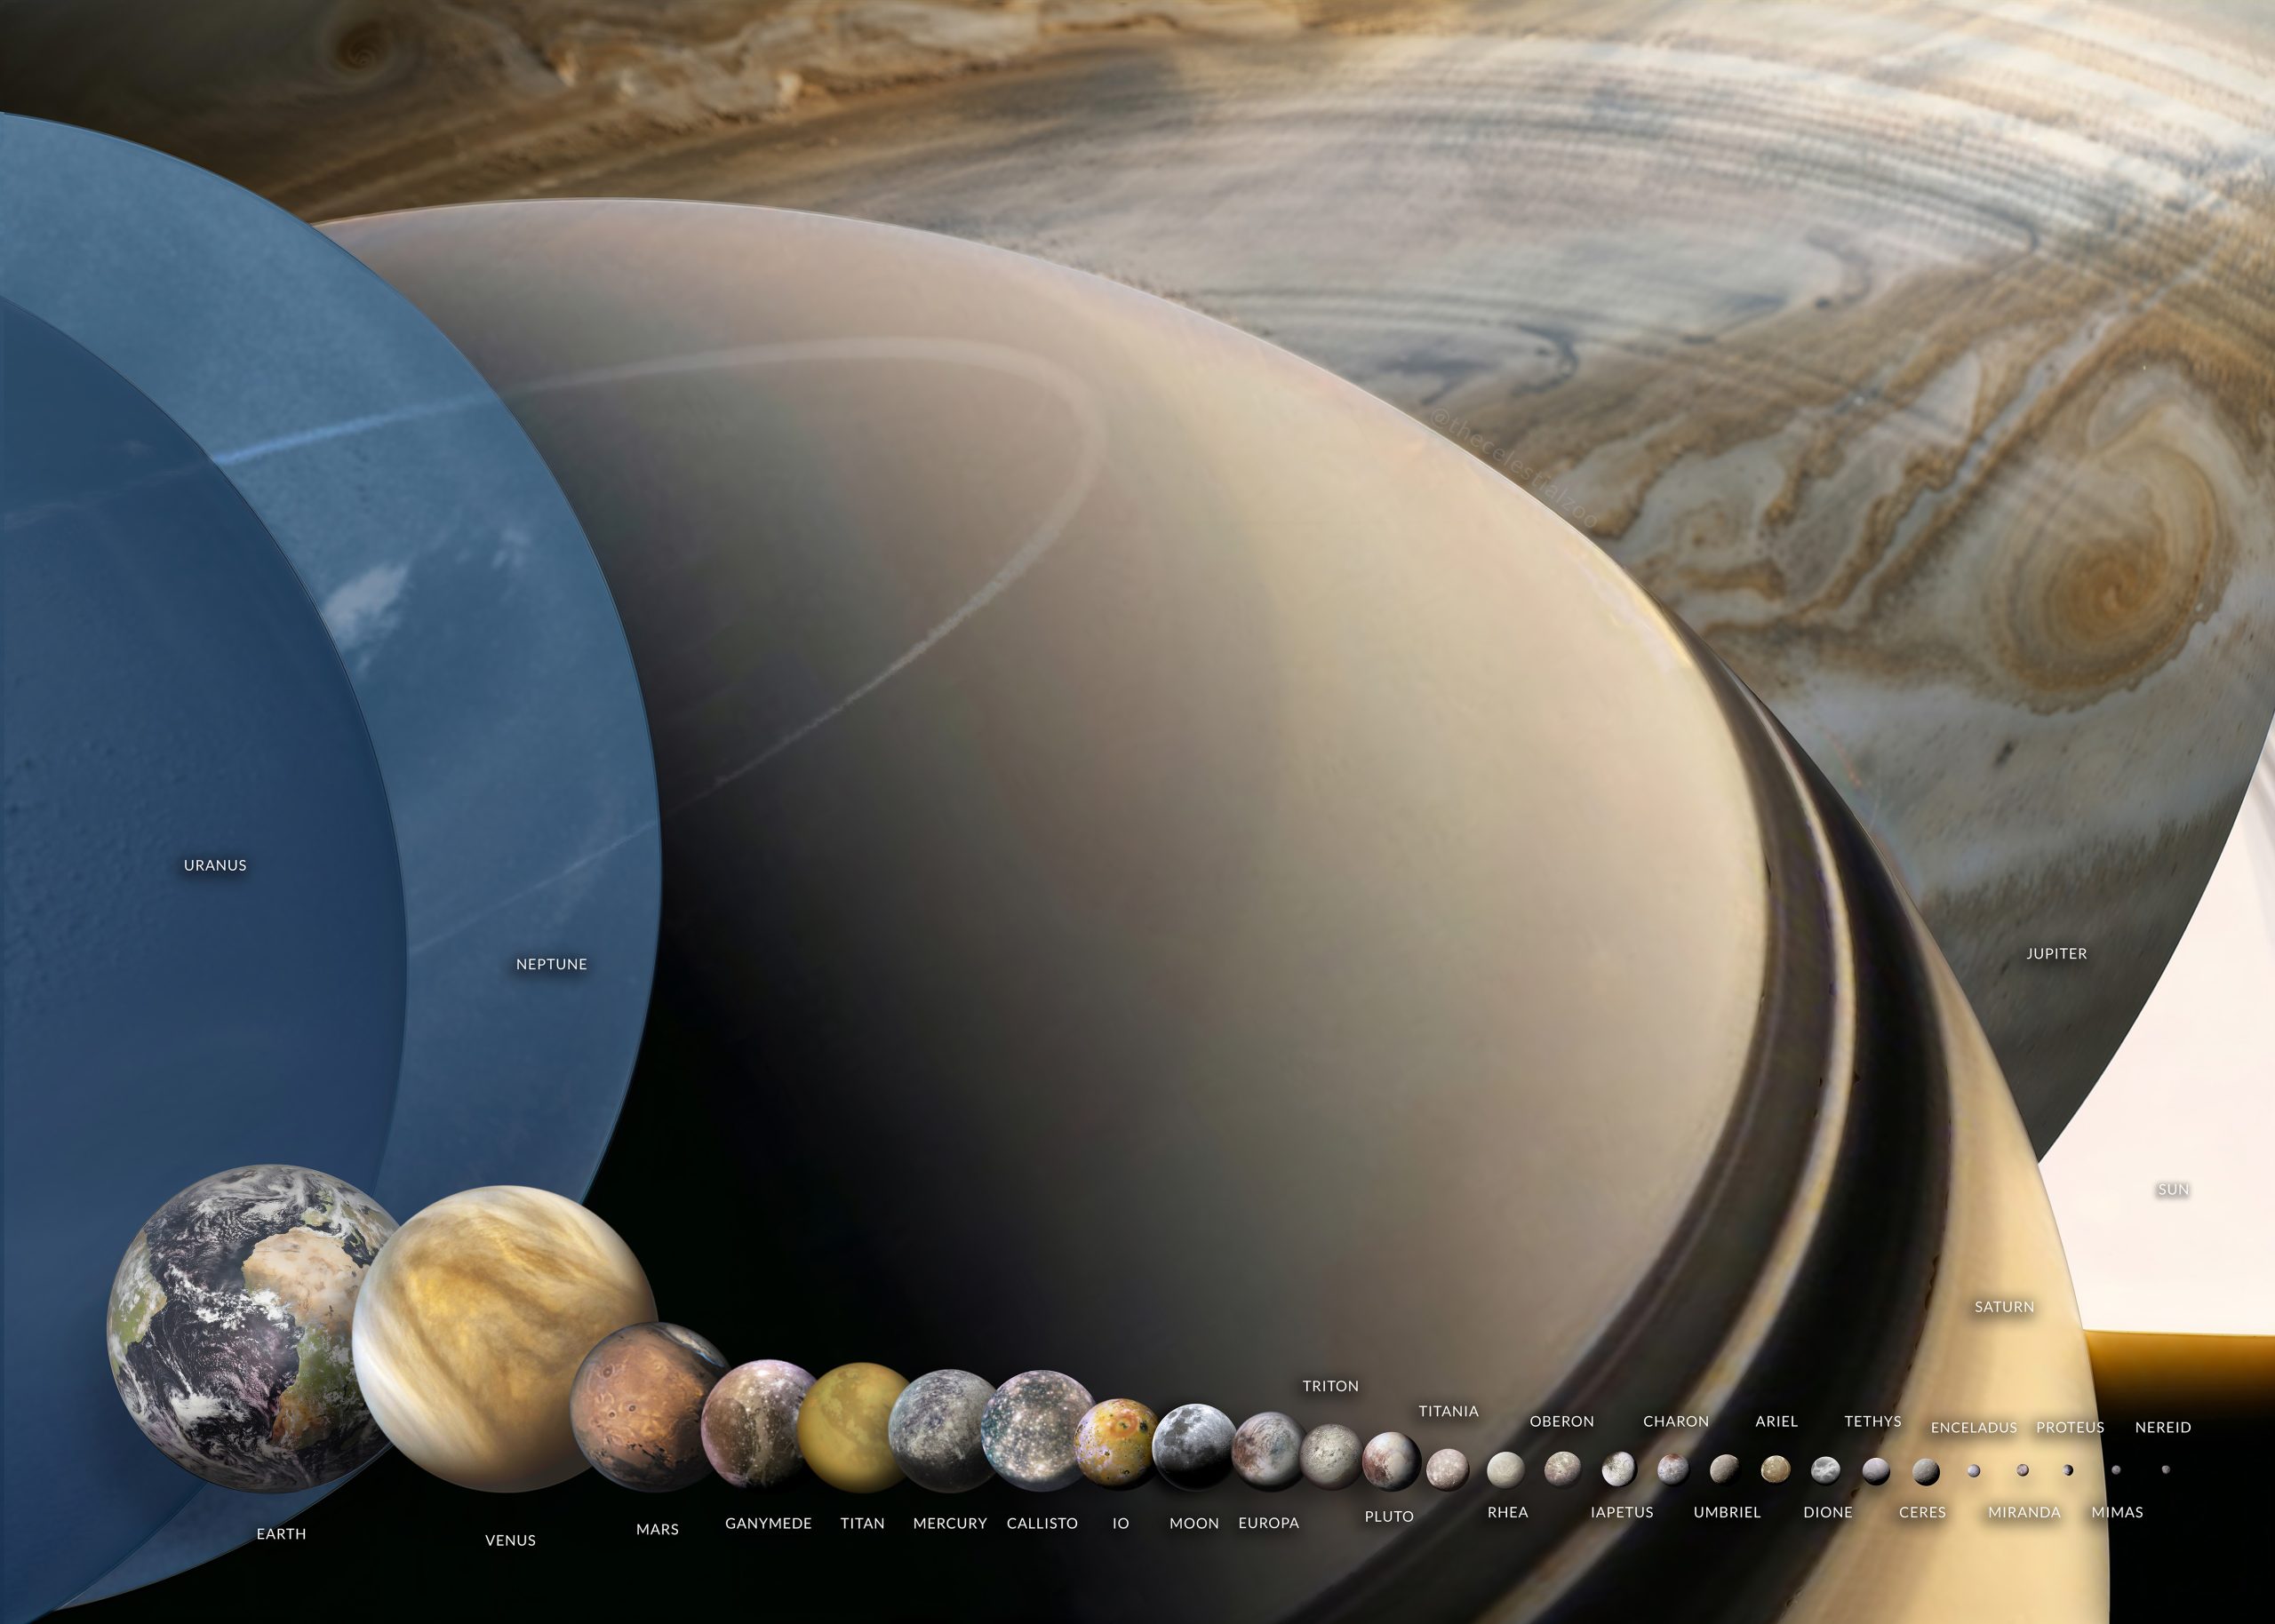
This illustration compares the relative sizes of planets and major moons in the solar system, arranging them side by side to highlight their scale differences. Smaller bodies like Pluto, Eris, and various icy moons are shown alongside Earth, Venus, and Mars, while the giant moons Ganymede, Titan, and Callisto appear nearly planet-sized. Behind them, the immense bulk of Jupiter and Saturn dominates the background, with translucent overlays marking the sizes of Uranus and Neptune. Altogether, the image emphasizes the striking contrast between terrestrial worlds, large moons, and the gas giants, offering a clear sense of proportion across the solar system. Designed by P. Budassi in 2024. Images by NASA/ESA.
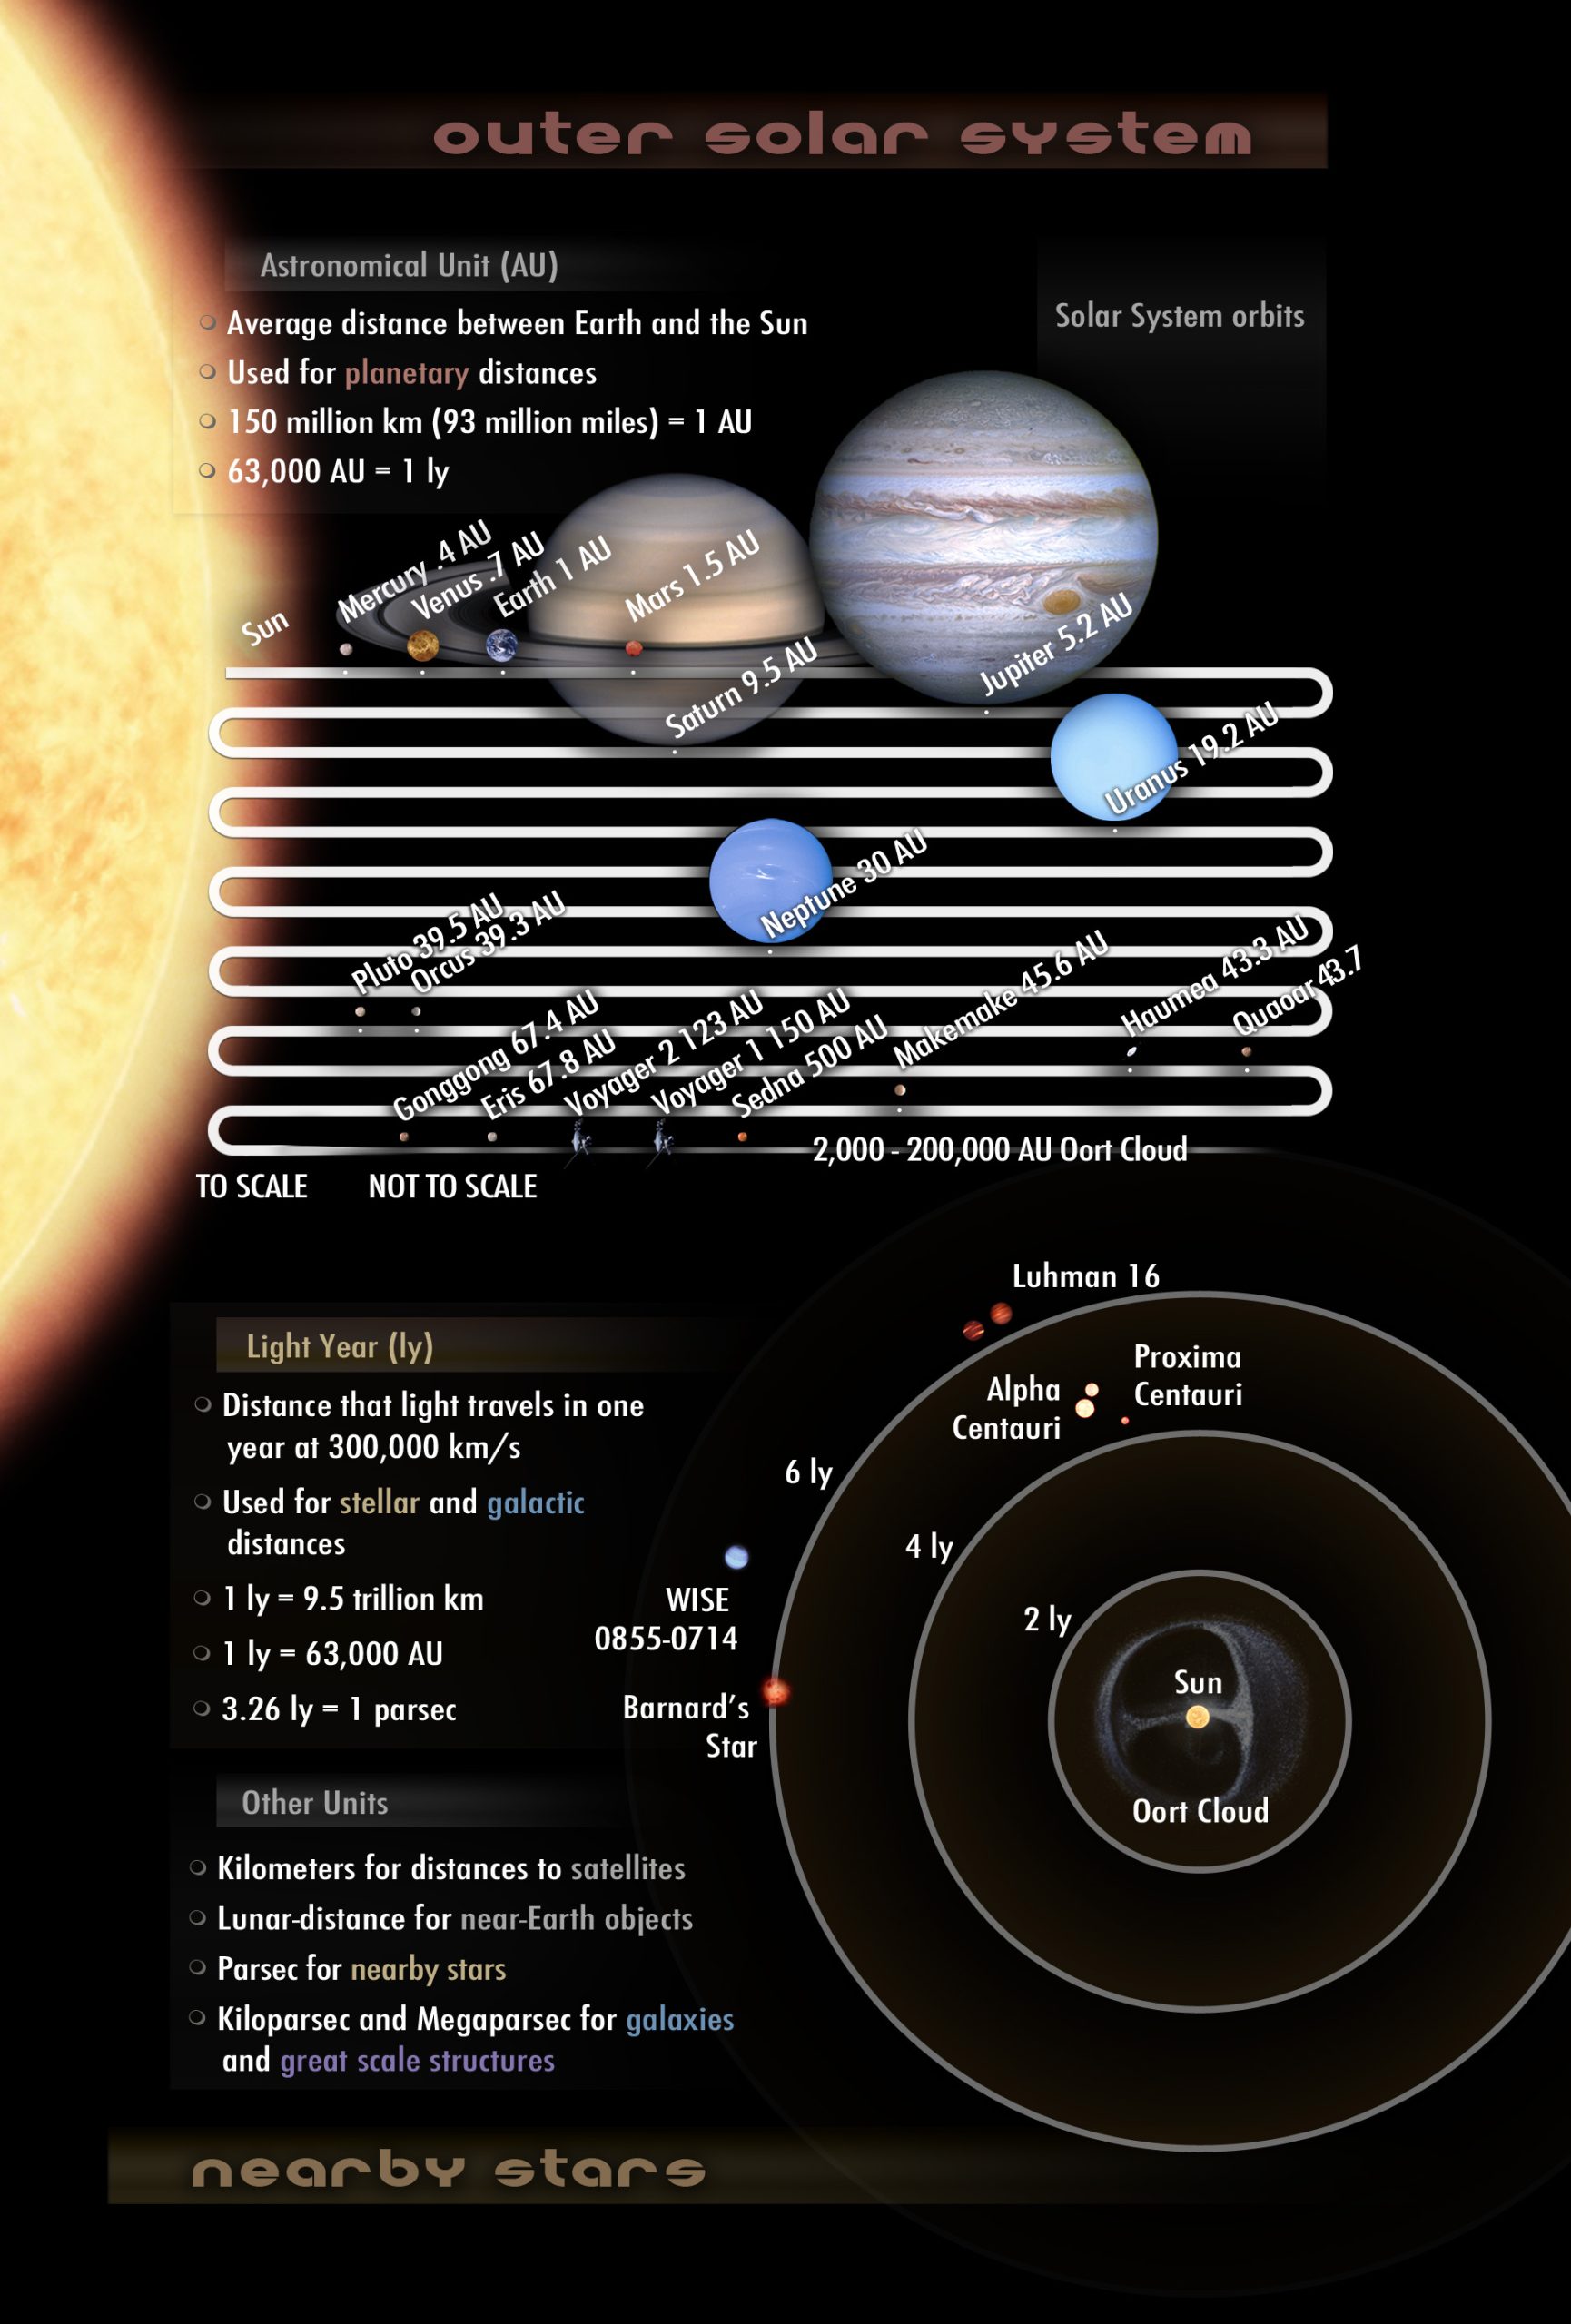
Presented below are three additional side views of our cosmic neighborhood, depicted to scale with an extraordinary level of detail:

[bit.ly/earthmoondiagram]
Detailed diagram showing objects between the Earth and the Moon including artificial satellites, relevant sized near-Earth passing asteroids (past and future), and the different distances the Moon can take from Earth.
[bit.ly/milkyandro]
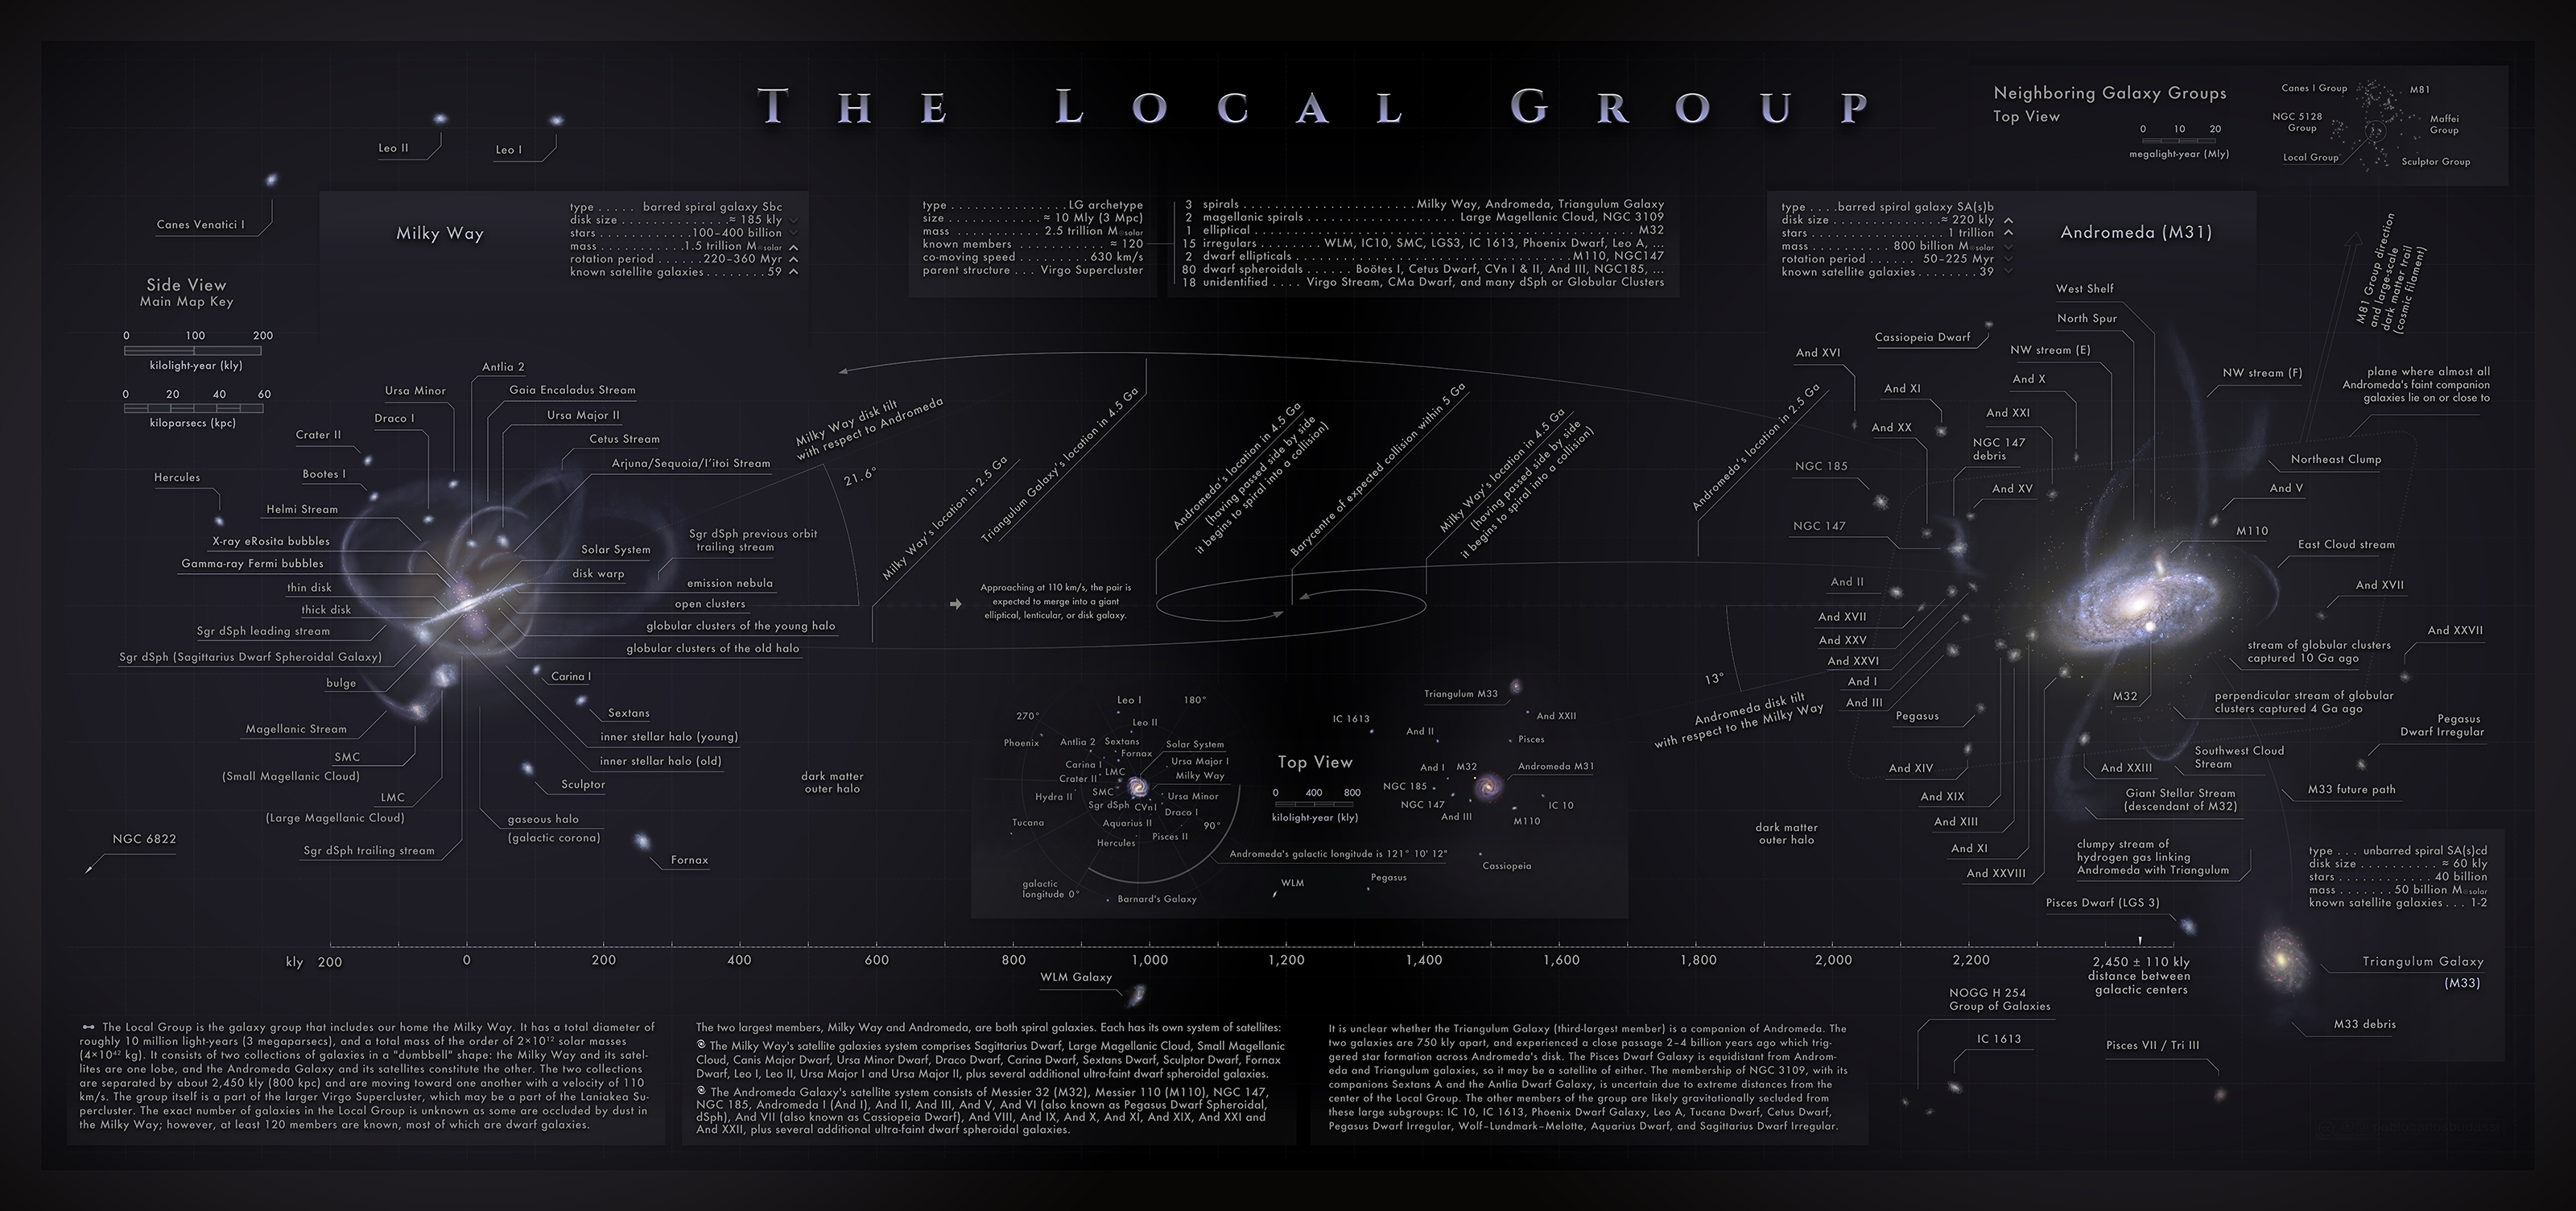
A side view of the Local Group of galaxies that contains the Milky Way, Andromeda and other 120 minor galaxies. The main map is accompanied by technical sheets and expected future path for major group members, top view and a neighboring groups scheme. Developed in July 2022 by Pablo Carlos Budassi. Last update: 5 Jul 2022.
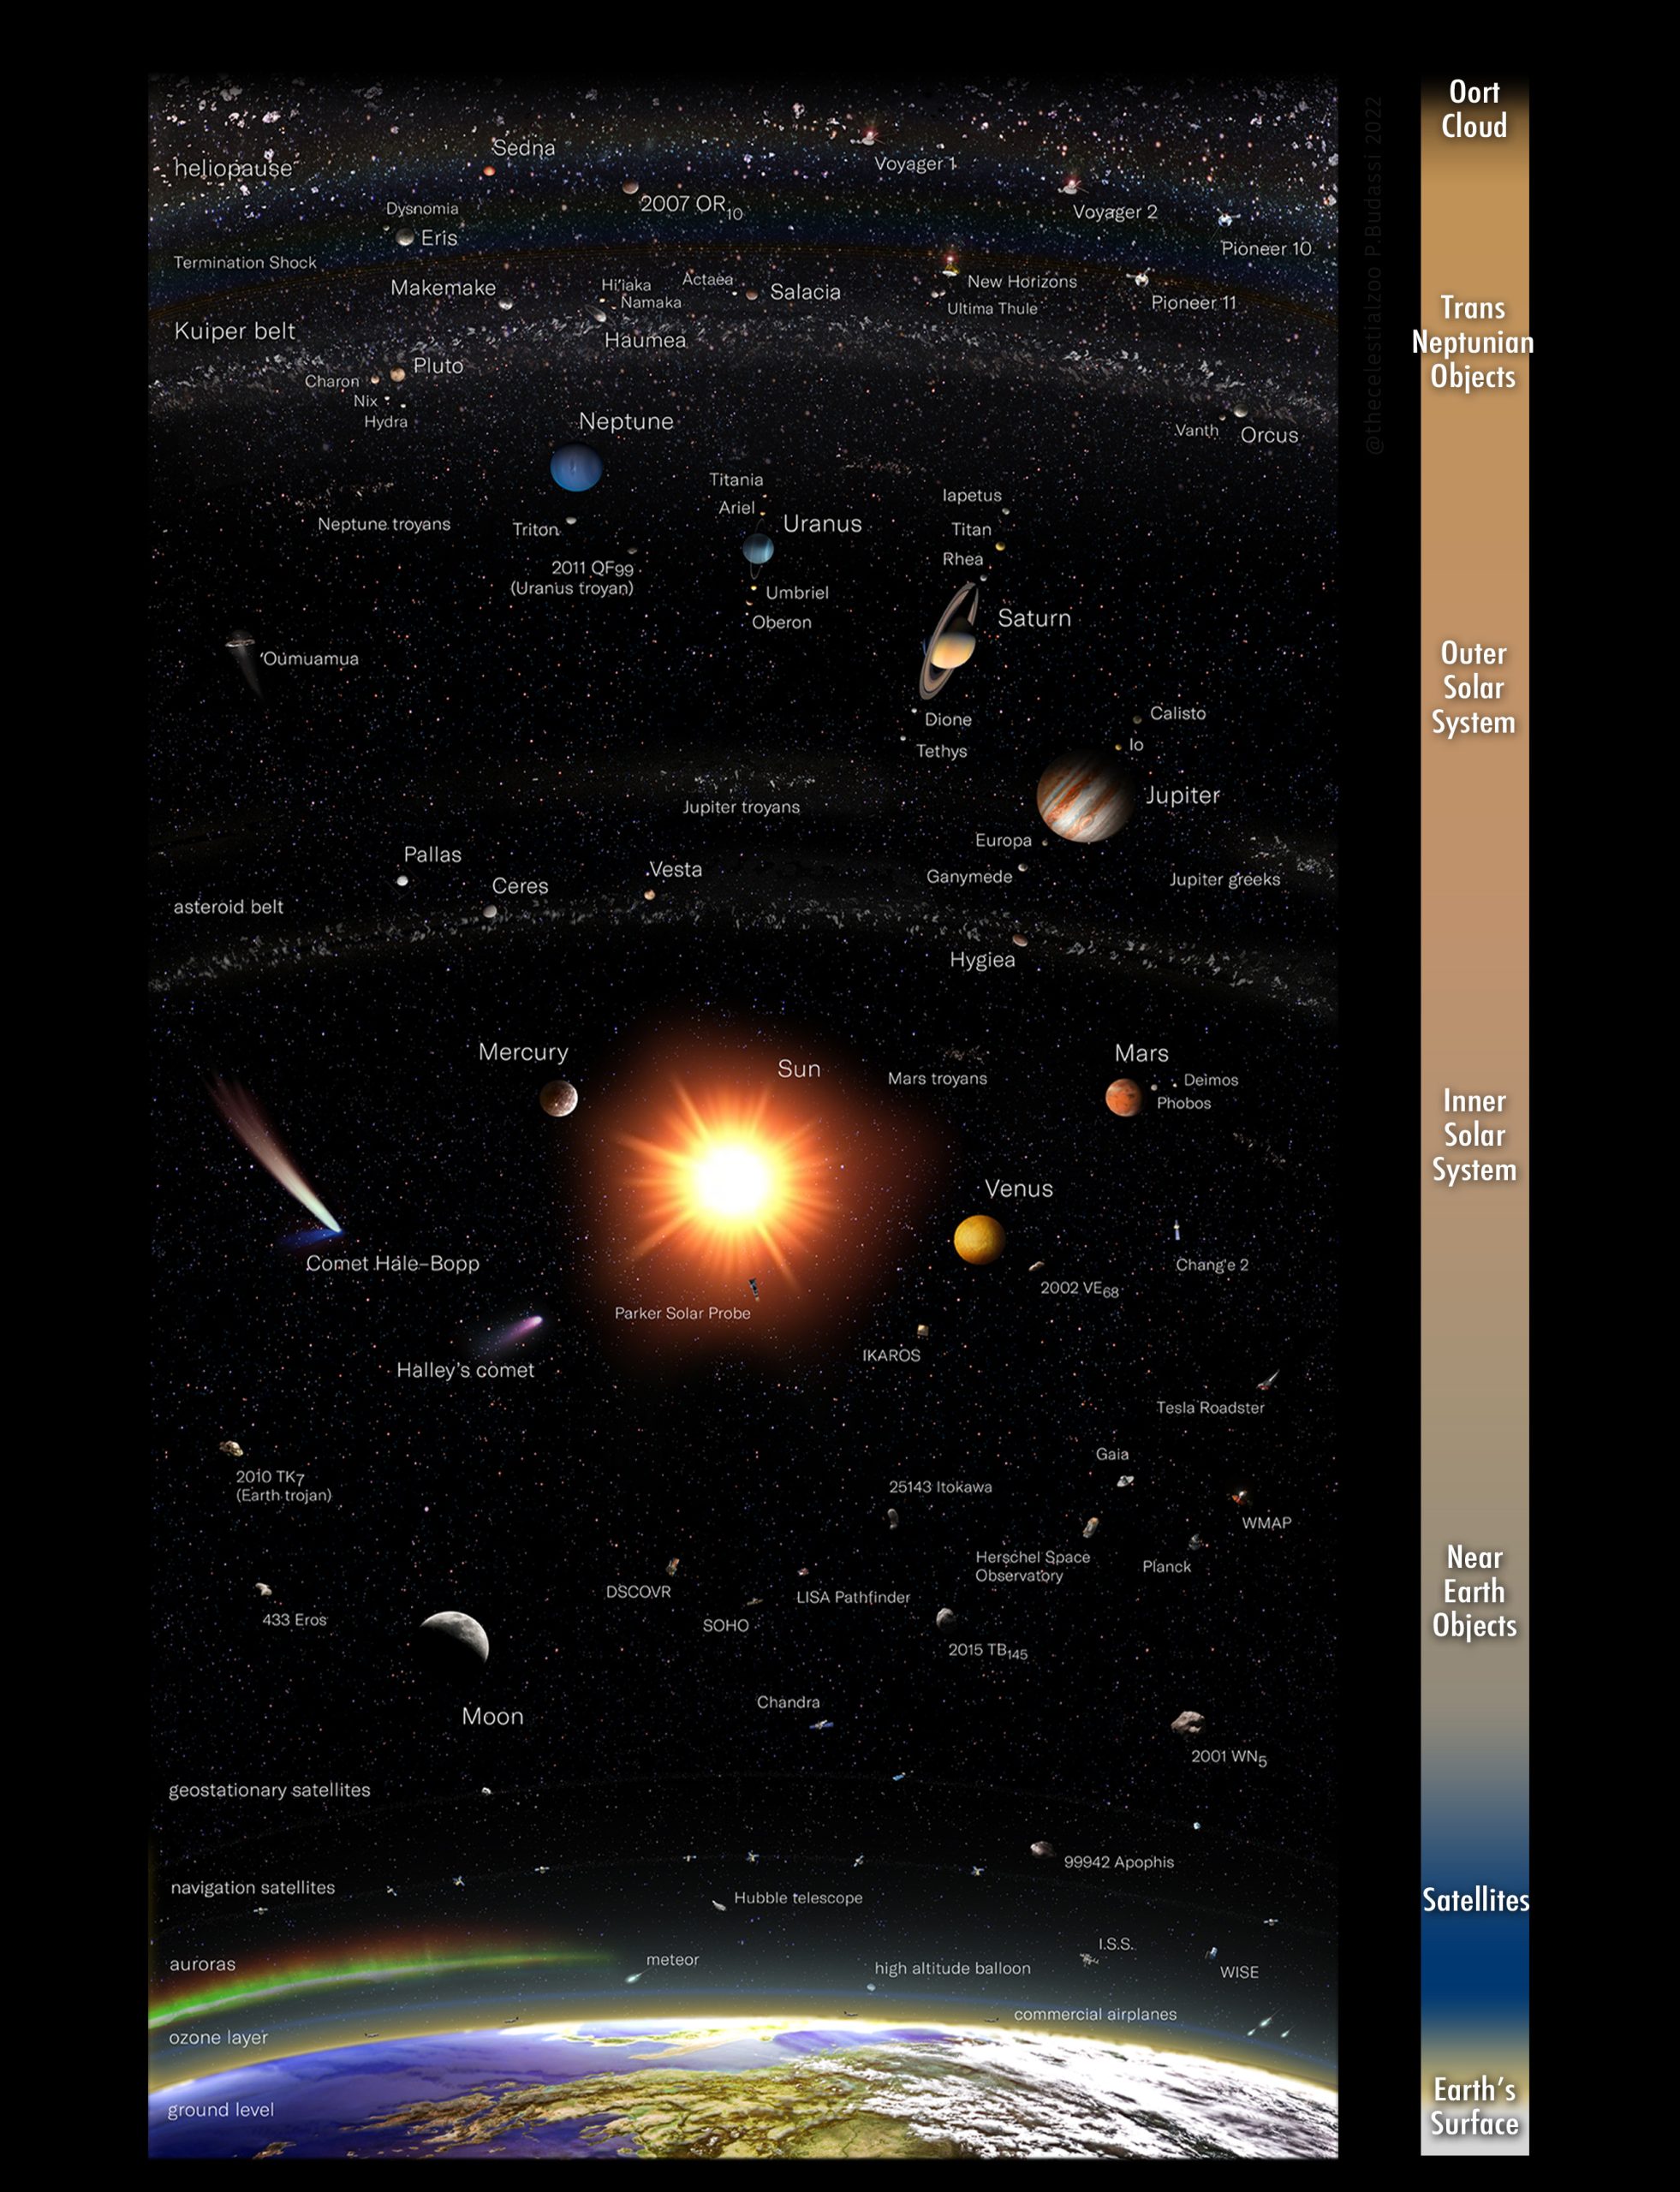
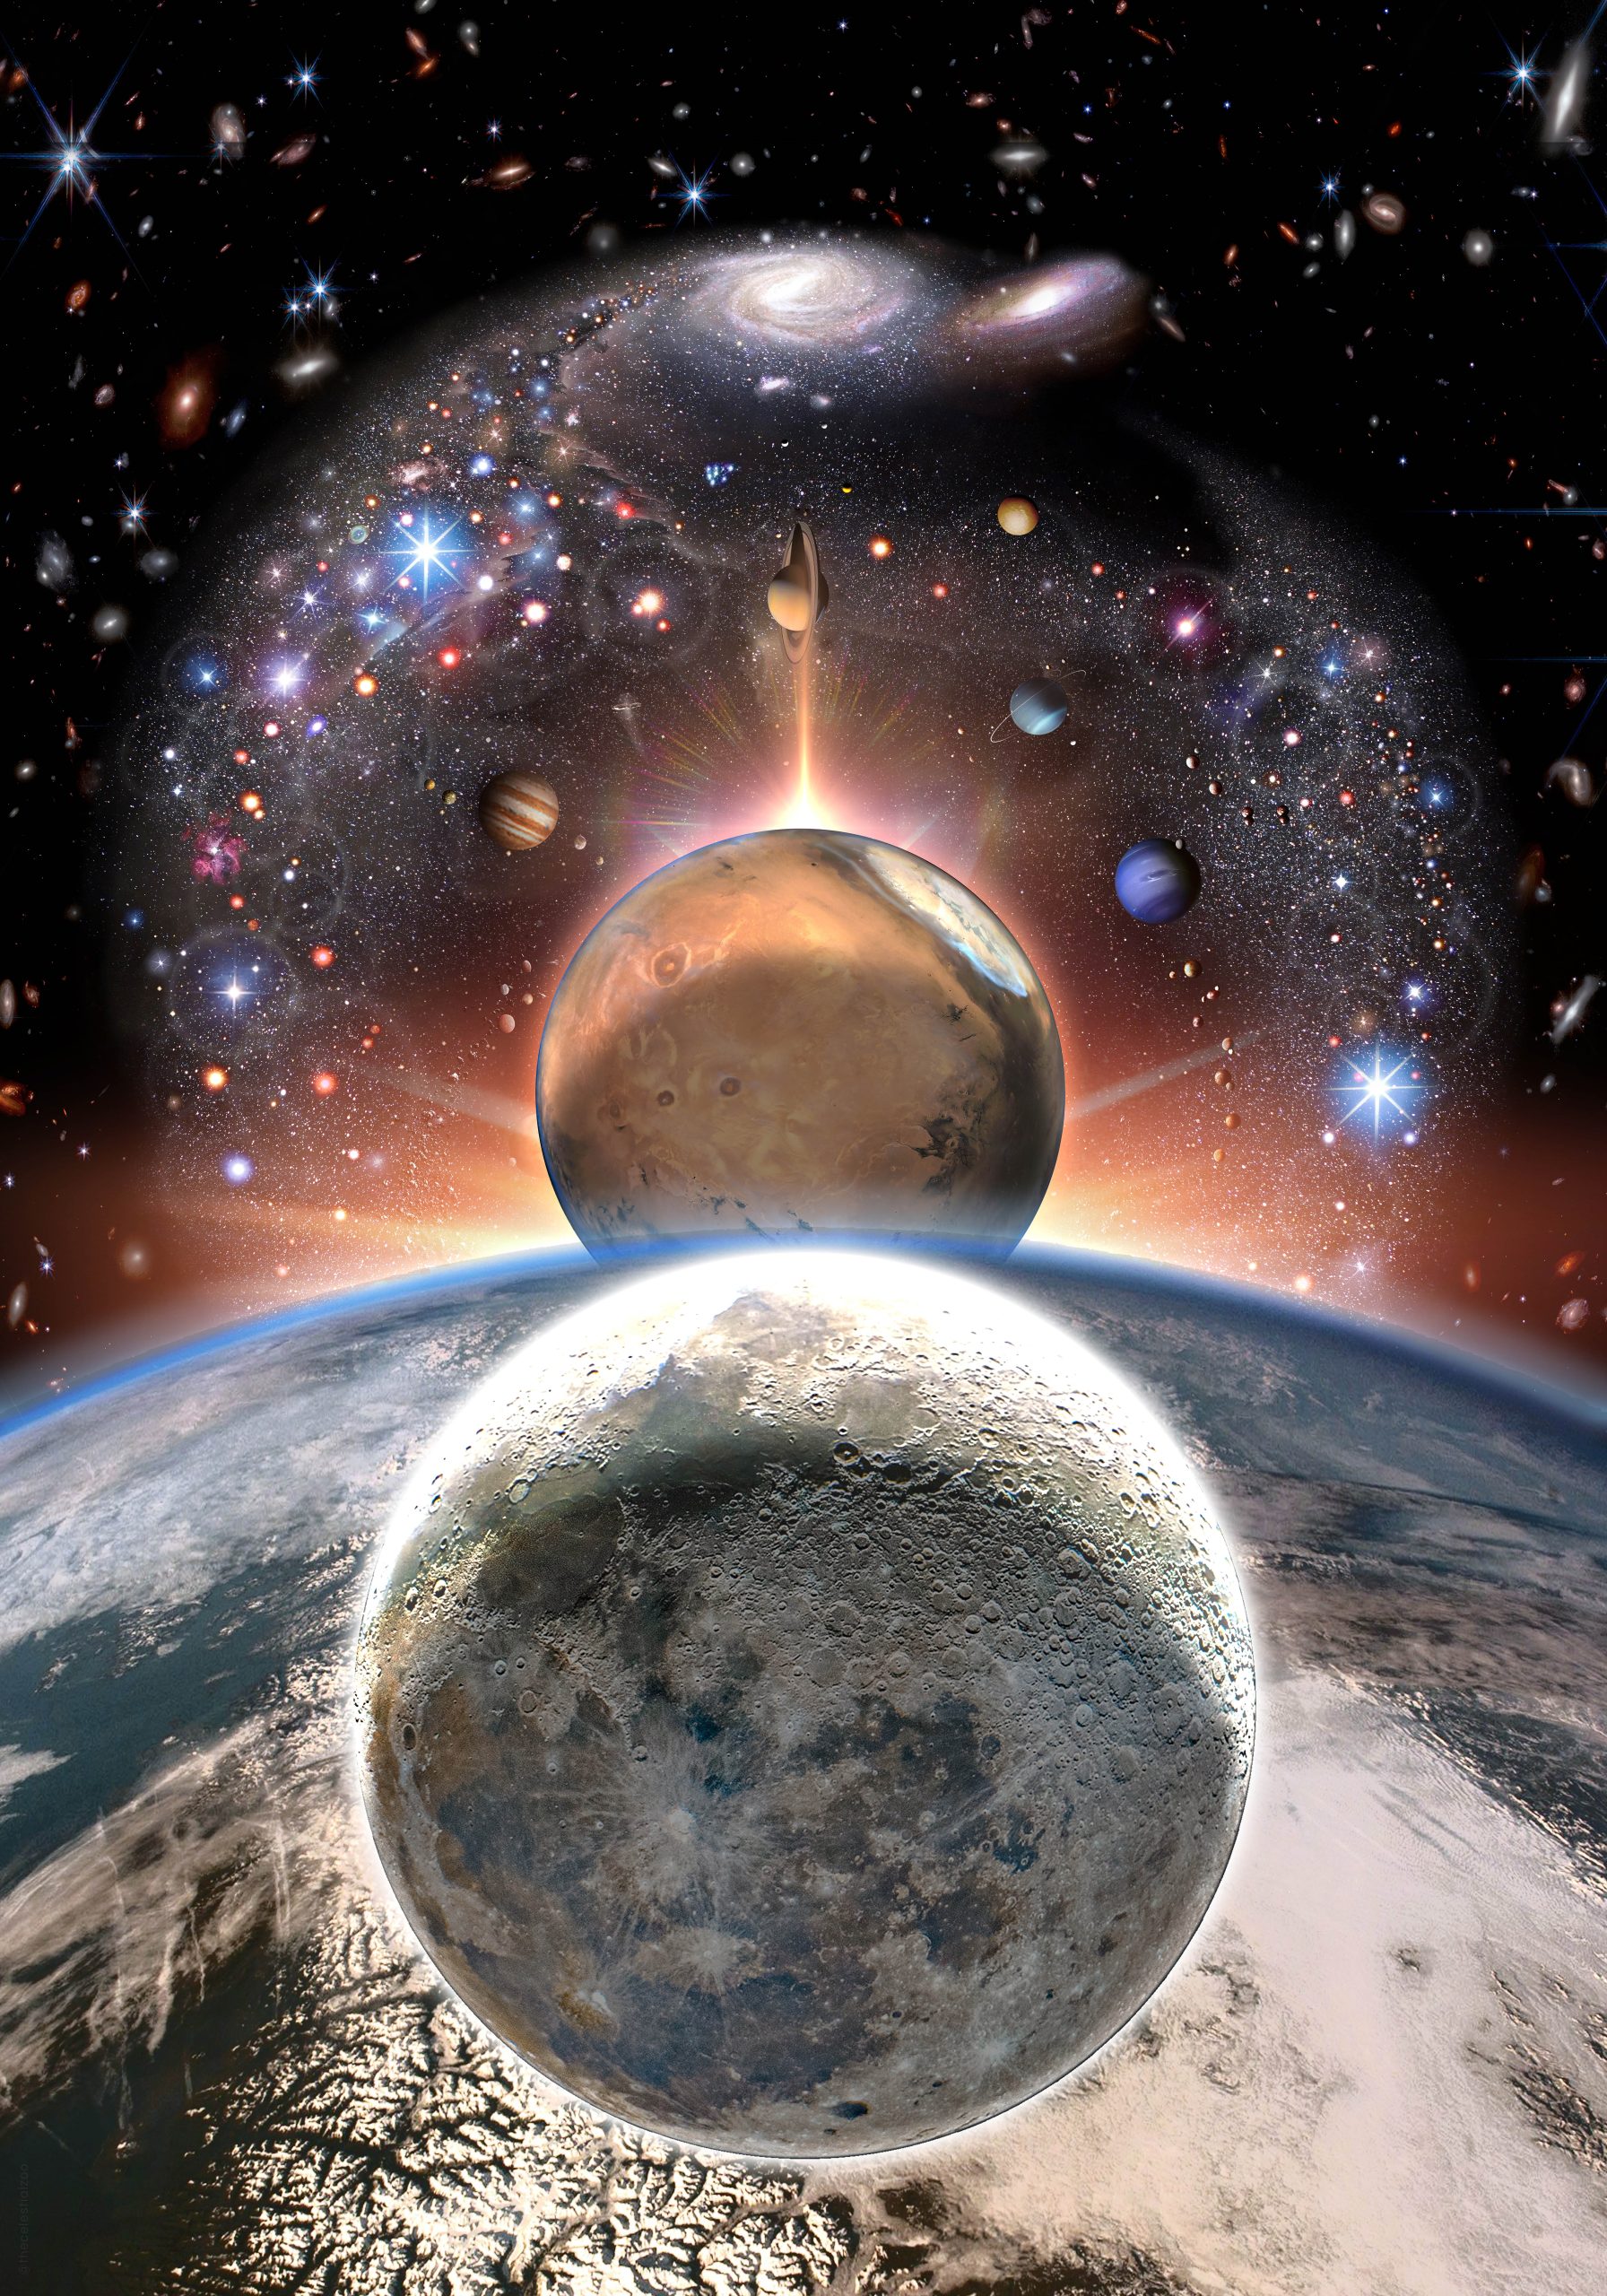
High quality metal plateTaller Map including the entire Observable Universe:
Overview of the Solar System objects with cool facts from Universe Guidebook:


* Become a Patron of this project for $2/mo and get full access to all our high-resolution works including the ones on this page.

